Visualization
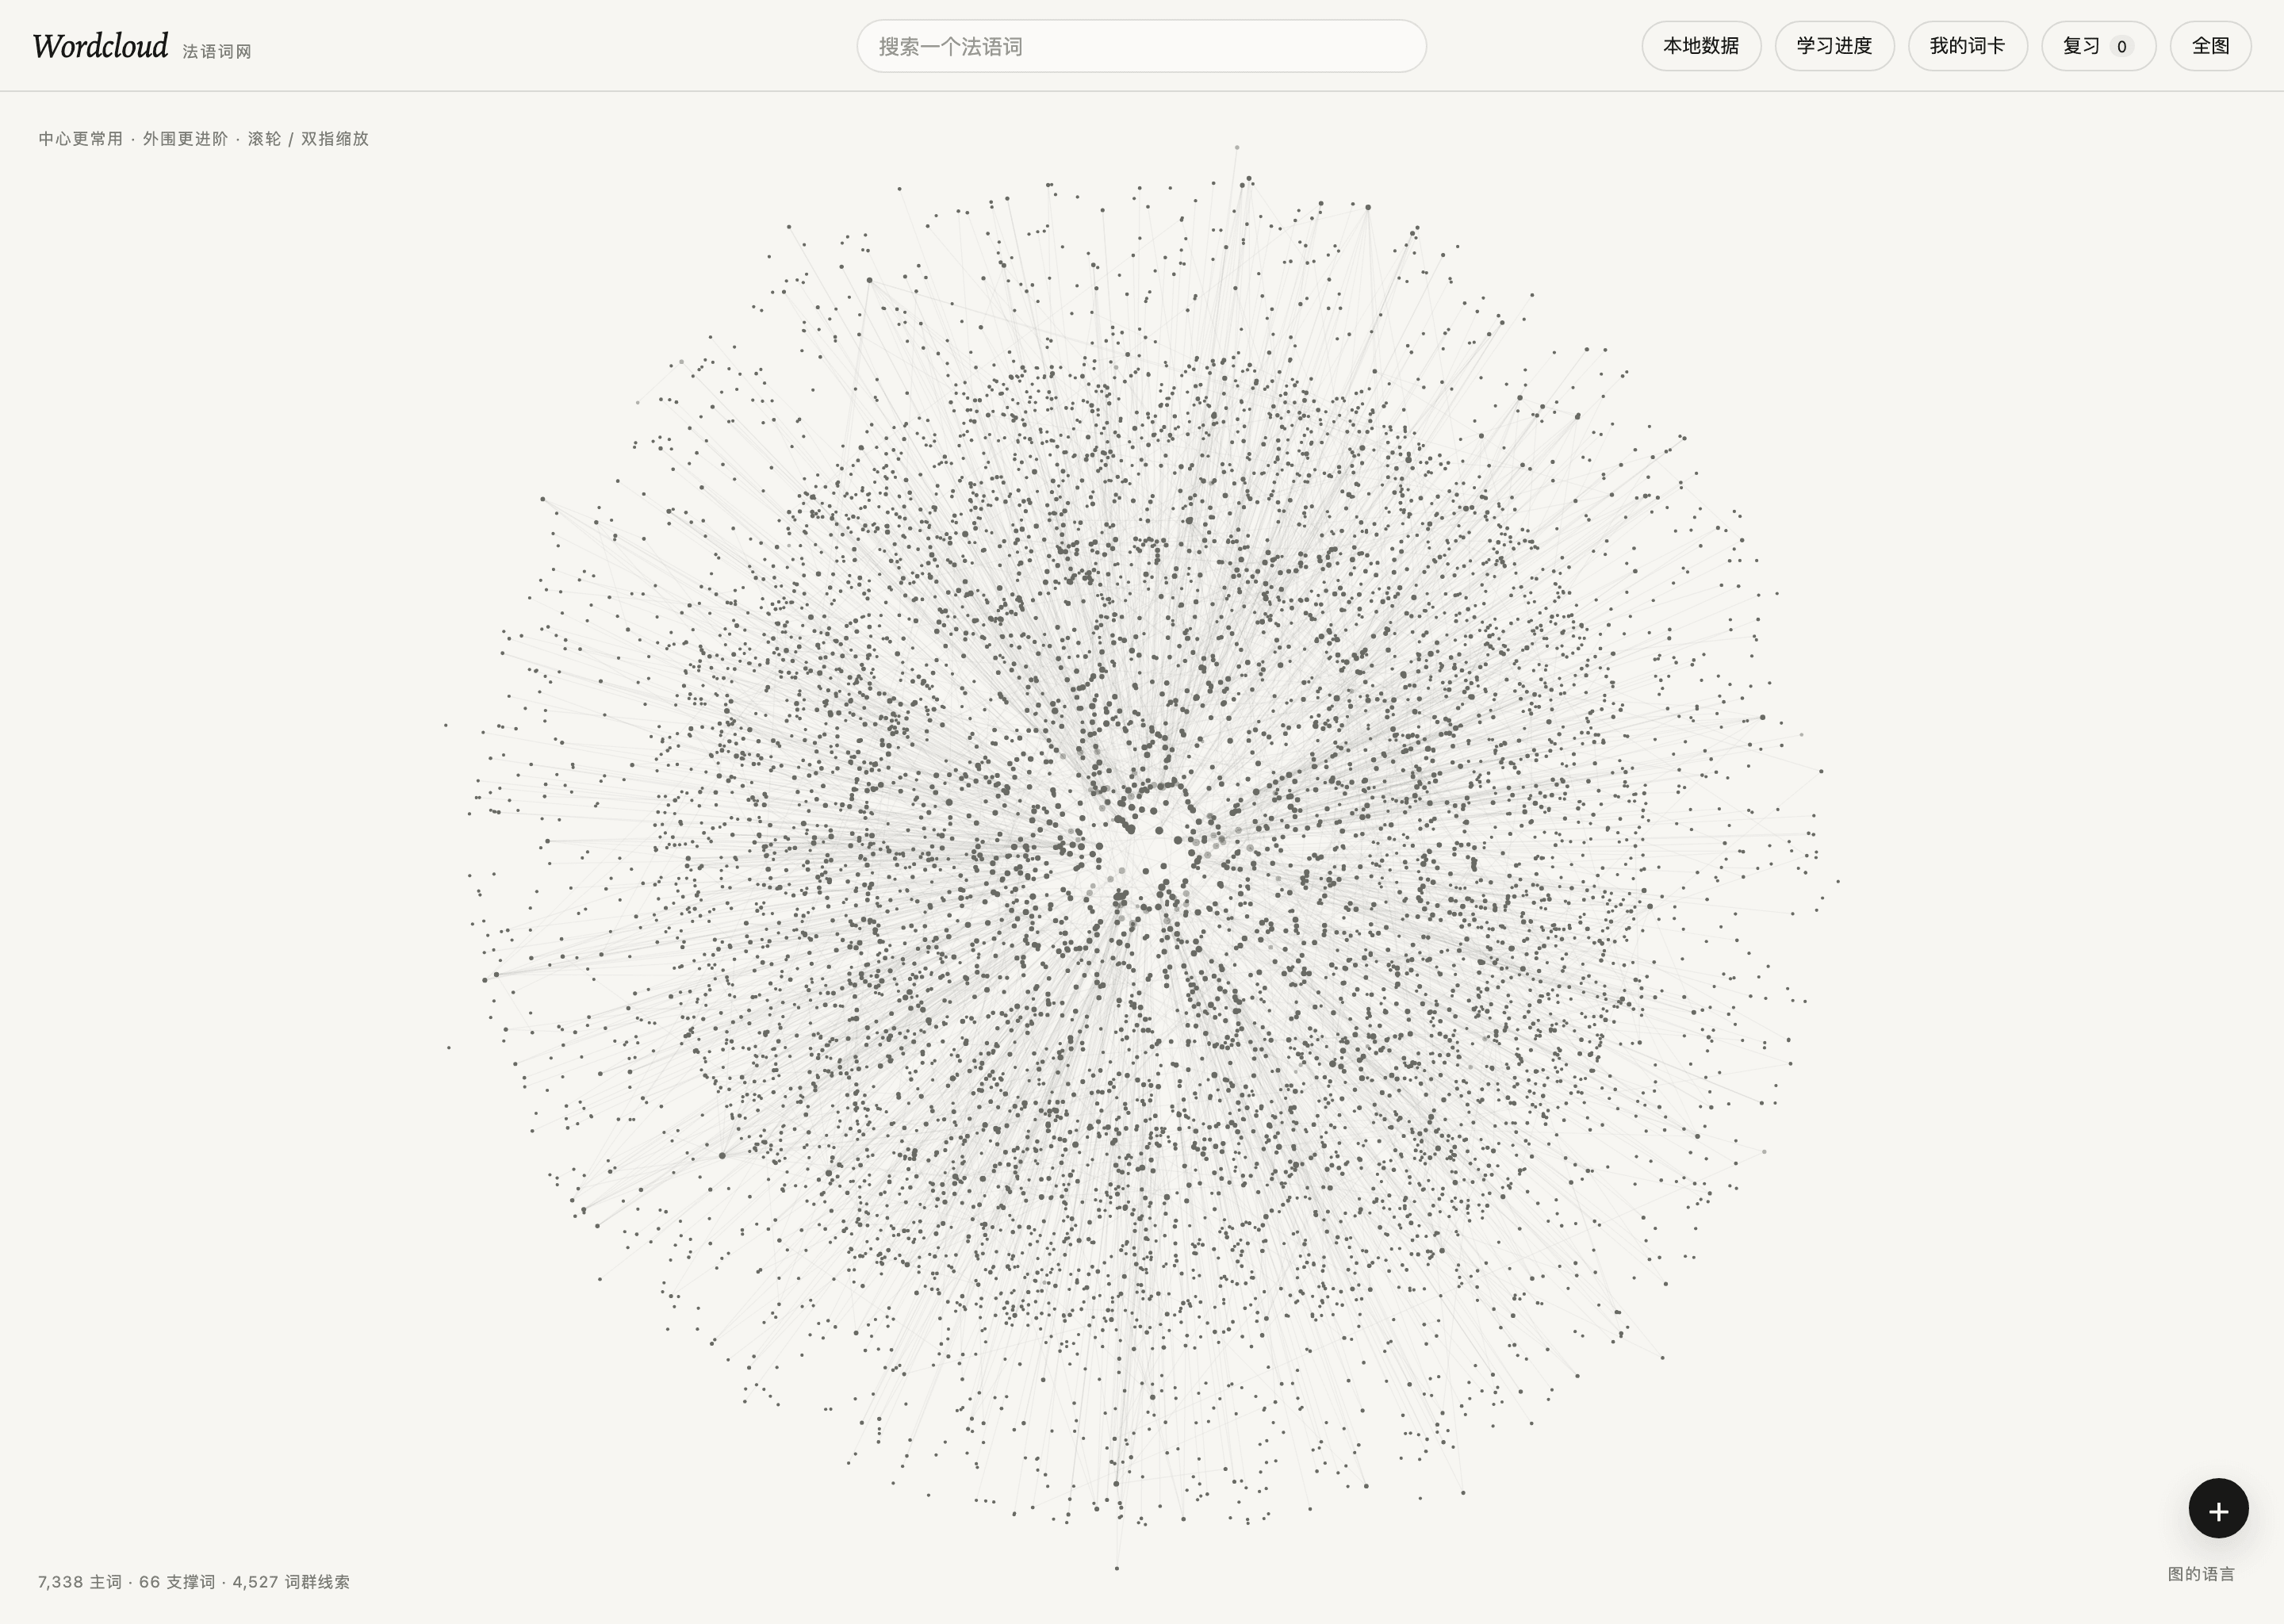
Wordcloud
An interactive lexical graph for exploring how French vocabulary connects.
StackJavaScript · HTML/CSS · Canvas · Graphology · Louvain · ForceAtlas2 · GitHub Pages
A browser-based visualization project that turns curated French lexical data into a navigable graph, combining deterministic layout, custom canvas rendering and learner-facing exploration.
Product problem
Vocabulary lists are easy to collect but hard to navigate. Learners often need to understand not only what a word means, but how it connects to families, contrasts, clusters and nearby concepts in a larger structure.
Key engineering decisions
The project treats vocabulary as graph data rather than flat content. Curated lexical sources are processed into a stable graph model, grouped through Louvain community detection, positioned through ForceAtlas2 and exported into a deterministic browser runtime.
Interaction model
The browser interface uses custom canvas rendering for the global map and focused word exploration. Learners can move between overview and single-word focus, then keep personal review, draft-card and learning state locally in the browser without requiring an account system.
Technical scope
Graph data modelling, layout computation, browser-side canvas interaction, lexical-source curation, deterministic export, local study-state design and static deployment packaging.
Curated lexical data
  ↓
Graph build → Louvain communities → ForceAtlas2 layout
  ↓
Deterministic export → Canvas runtime → learner exploration